BMR = Basal Metabolic Rate; RMR = Resting Metabolic rate.
Defined as: The level of energy expended by the body at rest sufficient to support the metabolic processes necessary for life.
Using Science Direct and PubMed I looked at the research available on the use of these formulae.
I looked at five pieces of research, and these form the basis of this post. Frankenfield et al (2005) is summarised:
- Frankenfield et al, Comparison of Predictive Equations for RMR in Health Non-Obese and Obese Adults: A Systematic Review. Journal of the American Dietetic Association (2005) 105: 775 – 789
- Shetty P. Energy Requirements of Adults. Public Health Nutrition (2005) 8 (7A), 994 – 1009
- Henry CJK. BMR Studies in Humans: Measurement and Development of New Equations. Public Health Nutrition (2005) 8 (7A), 1133 – 1152
- Frankenfield et al, Validation of Several Established Equations for RMR in Obese and Non-Obese people. Journal of the American Dietetic Association (2003) 103: 1152 – 1159
- Mifflin et al, A New Predictive Equation for Resting Energy Expenditure in Healthy Individuals. American Journal of Clinical Nutrition (1990) 51: 241 – 247
There appears to be four in current use; and their use is indeed widespread. Harris- Benedict (HB), Mifflin-St Jeor (Mifflin), Owen and the WHO/FAO/UNU.
- The Mifflin equation (1990) was derived from 498 normal-weight, overweight, obese and severely obese individuals; aged 19 – 78; the representation of older adults (75 – 84) was limited
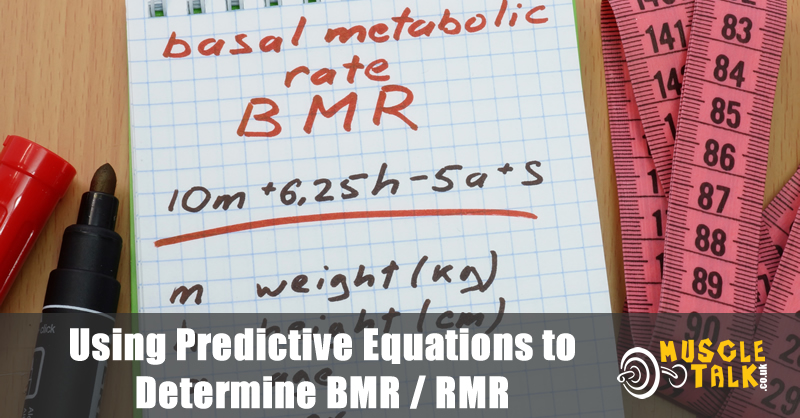
- Men: kcal/day = 9.99 x weight + 6.25 x height – 4.92 x age + 5
- Women: kcal/day = 9.99 x weight + 6.25 x height – 4.92 x age – 161
- The HB equation (1919) was developed using predominantly white normal-weight men aged 16 – 63 years (n=136); and women aged 15 – 74 years (n=103) over a ten year period. It is generally regarded to be a formula representing RMR and not BMR.
- Men: kcal/day = 66.47 + 13.75(wt) + 5.0(ht) – 6.75(age)
- Women: kcal/day = 655.09 + 9.56(wt) + 1.84(ht) – 4.67(age)
- The Owen equation (1986/87) for men was based on a sample of 60 subjects aged 18 – 82 years. The women’s equation from 44 women aged 18 – 65 years
- Men: kcal/day = 879 + 10.2 (wt)
- Women: kcal/day = 795 + 7.2 (wt)
- The WHO/FAO/UNU equations (1985) were developed from Schofield’s data: young European military/police recruits, 2279 men and 247 women, 45% of Italian descent, aged 19 – 82 years. Oldest-old are minimally represented.
- Men/weight (kg) only
- 18 – 30 15.3 x weight + 679
- 31 – 60 11.6 x weight + 879
- Men/weight and height (m)
- 18 – 30 15.4 x weight – 27 x height + 717
- 31 – 60 11.3 x weight + 16 x height + 901
- Women/weight only
- 18 – 30 14.7 x weight + 496
- 31 – 60 8.7 x weight + 829
- Women/Weight and height (m)
- 18 – 30 13.3 x weight + 334 x height + 35 31 – 60 8.7 x weight – 25 x height + 865
- Men/weight (kg) only
In all equations their strengths and weaknesses appears to lie in how representative they are; if an individual being measured is underrepresented in the original study, then the chances of the estimation being wrong, and the extent to which it is wrong, will be greater. Specifically identified areas of weakness: Obese subjects, ethnic minorities / non-white ethnic groups / African-American women; certain age groups/elderly subjects, certain populations underrepresented, e.g. those from the Tropics.
The WHO/FAO/UNU (Schofield’s data) and HB equations appear to have become less applicable over time, due simply to the number now overweight/obese; these are considered to be underrepresented in the original groups, due in part to the fact there weren’t so many of them about! Such a development is surely to be expected. A variation of the HB equation is now available for those with a BMI > 30
Frankenfield et al (2005) posed the question: “Which predictive methods of RMR work the best, and how accurate are they for an individual?”
For healthy, non-obese individuals
- The Mifflin equation performed the best; in 82% of cases, the prediction was ±10% of measured RMR
- HB: accurate prediction of RMR occurred in 45% to 80% of individuals
- The Owen equation predicted within ±10% measured RMR in 73% of individuals
- The WHO/FAO/UNU equation could not be evaluated
For obese, but otherwise healthy individuals
The accuracy rate decreased compared with non-obese adults, and the range of errors increased. This was less prominent in the Mifflin equation.
The panel found that in healthy non-obese and obese individuals, the performance of the commonly applied HB equation is surpassed by the Mifflin equation in terms of both accuracy rate and lower magnitude of error (Frankenfield et al, 2005).
Current calculation methods for estimating RMR have clinically important limitations, including undetectable differences from measured RMR, lower accuracy rates in obesity, and gaps in our knowledge of how the equations work in various ethnic groups and elderly subjects (Frankenfield et al, 2005).
It appears that after ‘extensive’ but not exhaustive research, that the limitations are apparent, for obvious reasons. In a clinical setting, these discrepancies may have serious consequences; but this is not a clinical setting.
Unless I am subsequently convinced otherwise, I will continue to use the predictive formulae (Mifflin probably after this exercise!); and as I have always done I will suggest that the result be used as a reference/starting point only; I will then advise, as I have always done, to monitor and adjust accordingly…